Author name: ITMAITY

tech blog

Highlights from Git 2.52

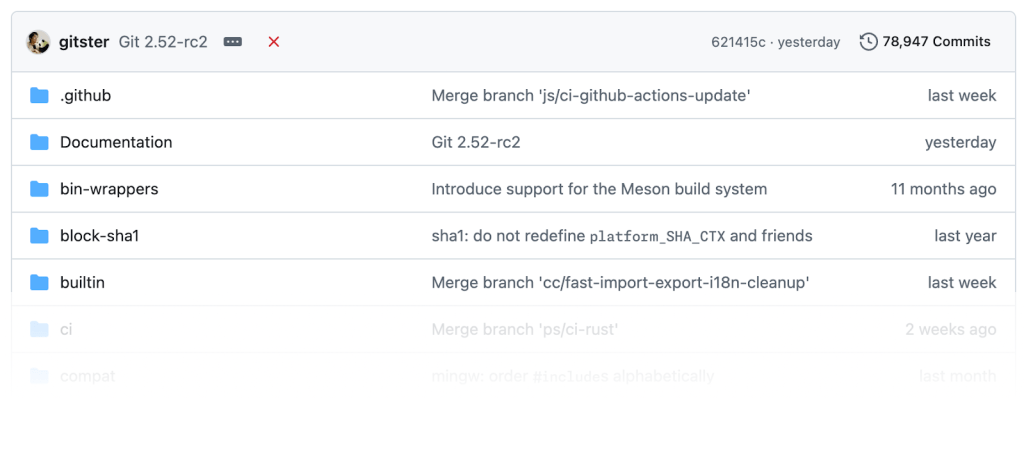
The open source Git project just released Git 2.52 with features and bug fixes from over 94 contributors, 33 of them new. We last caught up with you on the latest in Git back when 2.51 was released. To celebrate this most recent release, here is GitHub’s look at some of the most interesting features and changes introduced since last time. Tree-level blame information If you’re a seasoned Git user, then you are no doubt familiar with git blame, Git’s tool for figuring out which commit most recently modified each line at a given filepath. Git’s blame functionality is great for figuring out when a bug was introduced, or why some code was written the way it was. If you want to know which commit last modified any portion of a given filepath, that’s easy enough to do with git log -1 — path/to/my/file, since -1 will give us only the first commit which modifies that path. But what if instead you want to know which commit most recently modified every file in some directory? Answering that question may seem contrived, but it’s not. If you’ve ever looked at a repository’s file listing on GitHub, the middle column of information has a link to the commit which most recently modified that path, along with (part of) its commit message. GitHub’s repository file listing, showing tree-level blame information. The question remains: how do we efficiently determine which commit most recently modified each file in a given directory? You could imagine that you might enumerate each tree entry, feeding it to git log -1 and collecting the output there, like so: $ git ls-tree -z –name-only HEAD^{tree} | xargs -0 -I{} sh -c ‘ git log -1 –format=”$1 %h %s” — $1 ‘ — {} | column -t -l3 .cirrus.yml 1e77de10810 ci: update FreeBSD image to 14.3 .clang-format 37215410730 clang-format: exclude control macros from SpaceBeforeParens .editorconfig c84209a0529 editorconfig: add .bash extension .gitattributes d3b58320923 merge-file doc: set conflict-marker-size attribute .github 5db9d35a28f Merge branch ‘js/ci-github-actions-update’ […] That works, but not efficiently. To see why, consider a case with files A, B, and C introduced by commits C1, C2, and C3, respectively. To blame A, we walk from C3 back to C1 in order to determine that C1 was the most recent commit to modify A. That traversal passed through C2 and C3, but since we were only looking for modifications to A, we’ll end up revisiting those commits when trying to blame B and C. In this example, we visit those three commits six times in total, which is twice the necessary number of history traversals. Git 2.52 introduces a new command which comes up with the same information in a fraction of the time: git last-modified. To get a sense for how much faster last-modified is than the example above, here are some hyperfine results: Benchmark 1: git ls-tree + log Time (mean ± σ): 3.962 s ± 0.011 s [User: 2.676 s, System: 1.330 s] Range (min … max): 3.940 s … 3.984 s 10 runs Benchmark 2: git last-modified Time (mean ± σ): 722.7 ms ± 4.6 ms [User: 682.4 ms, System: 40.1 ms] Range (min … max): 717.3 ms … 731.3 ms 10 runs Summary git last-modified ran 5.48 ± 0.04 times faster than git ls-tree + log The core functionality behind git last-modified was written by GitHub over many years (originally called blame-tree in GitHub’s fork of Git), and is what has powered our tree-level blame since 2012. Earlier this year, we shared those patches with engineers at GitLab, who tidied up years of development into a reviewable series of patches which landed in this release. There are still some features in GitHub’s version of this command that have yet to make their way into a Git release, including an on-disk format to cache the results of previous runs. In the meantime, check out git last-modified, available in Git 2.52. [source, source, source] Advanced repository maintenance strategies Returning readers of this series may recall our coverage of the git maintenance command. If this is your first time reading along, or you could use a refresher, we’ve got you covered. git maintenance is a Git command which can perform repository housekeeping tasks either on a scheduled or ad-hoc basis. The maintenance command can perform a variety of tasks, like repacking the contents of your repository, updating commit-graphs, expiring stale reflog entries, and much more. Put together, maintenance ensures that your repository continues to operate smoothly and efficiently. By default (or when running the gc task), git maintenance relies on git gc internally to repack your repository, and remove any unreachable objects. This has a couple of drawbacks, namely that git gc performs “all-into-one” repacks to consolidate the contents of your repository, which can be sluggish for very large repositories. As an alternative, git maintenance has an incremental-repack strategy, but this never prunes out any unreachable objects. Git 2.52 bridges this gap by introducing a new geometric task within git maintenance that avoids all-into-one repacks when possible, and prunes unreachable objects on a less frequent basis. This new task uses tools (like geometric repacking) that were designed at GitHub and have powered GitHub’s own repository maintenance for many years. Those tools have been in Git since 2.33, but were awkward to use or discover since their implementation was buried within git repack, not git gc. The geometric task here works by inspecting the contents of your repository to determine if we can combine some number of packfiles to form a geometric progression by object count. If it can, it performs a geometric repack, condensing the contents of your repository without pruning any objects. Alternatively, if a geometric repack would pack the entirety of your repository into a single pack, then a full git gc is performed instead, which consolidates the contents of your repository and prunes out unreachable objects. Git 2.52 makes it a breeze to keep even your largest repositories running smoothly. Check out the new geometric strategy, or

tech blog

Level up design-to-code collaboration with GitHub’s open source Annotation Toolkit

If you’ve ever been handed a design file and thought, “Wait—what exactly is this supposed to do?” you’re not alone.  The handoff between designers and developers is one of the most common points where product workflows break down. You are looking at components and trying to figure out what’s interactive, what’s responsive, what happens when text gets bigger. The designer is trying to express something that isn’t directly stated on the canvas. Somewhere in that gap, accessibility considerations get missed. Knowledge walks out the door in lost Slack threads. Then it all comes back later as a bug that could have been prevented if messages weren’t missed or if expectations had been clearer upfront. GitHub’s accessibility design team ran into this exact problem internally. They looked at their own accessibility audit data and realized something striking: nearly half of accessibility audit issues (48%) could have been prevented if design intent had been better documented upfront by integrating WCAG (Web Content Accessibility Guidelines) considerations directly into annotations. So they built something to fix it. And now they’ve open sourced it. It’s called the Annotation Toolkit, and it’s a Figma library designed to make the handoff easier. The framework brings structure, clarity, and accessibility-first practices into every design-to-code interaction. What the Annotation Toolkit is (and isn’t) At its core, the Annotation Toolkit is a Figma library of stamps (annotations) that you can drop into your designs. Each annotation lets you: Express design intent beyond what’s visually on the canvas. Document accessibility behaviors like responsive reflow or table handling. Guide engineers clearly by linking numbered stamps to descriptions. Instead of documenting all this in Figma comments (which get lost), Slack threads (which disappear), or scattered one-off clarifications (which nobody can remember later), the annotations live right inside your design file. They’re numbered, they’re portable, and they stay with your work. Think of it like embedding clarity directly into the handoff. Why it matters: Accessibility by default The toolkit was built by GitHub’s accessibility design team specifically so that accessibility considerations aren’t something you bolt on at the end. They’re baked into the design workflow from the start. Each annotation comes with built-in guidance. Want to mark a table? The toolkit addresses nearly every design-preventable accessibility issue under WCAG guidelines, including things like reflow behavior. Adding an image? It prompts you to document the context so developers can write proper alt text. The toolkit doesn’t just let you document accessibility—it teaches you as you go. That’s not a small thing. It means developers stop guessing. It means accessibility isn’t a specialist concern anymore, but is part of the conversation from day one. Real-world application: From pain points to productivity Before this toolkit, GitHub teams relied on a patchwork of Figma comments, Slack threads, and one-off clarifications. This patched approach resulted in knowledge gaps and repeated accessibility oversights. But now, annotations provide: Clarity at scale: engineers no longer guess at intended behaviors.Consistency across teams: designers, product managers (PM), and developers all share a common language. Preventative QA: many issues are resolved at the design stage instead of post-build. Annotations enable Figma to become more than just a canvas. It’s a tool for expressing a much deeper level of information. @hellojanehere, product manager at GitHub Tutorial: How to use the Annotation Toolkit How to get started You’ve got two paths here, so pick whichever feels easier: Option 1: From Figma Community (fastest) Head to the @github profile on Figma (figma.com/@github). Find the Annotation Toolkit and click the link to duplicate it. It goes straight to your drafts. Access the components anytime from your Assets tab. Option 2: From GitHub (if you want all the docs at once) Visit github.com/github/annotation-toolkit. Download the exported Figma file from the repo. Open it in Figma and duplicate it to your workspace. Same deal—find components in your Assets tab. Once you’ve got the toolkit, adding your first annotation is straightforward. Open any design file, drag an annotation stamp into it (say, the Image annotation on a profile picture), and you’ll see a numbered label appear. Pair that number with a description block and write what you need. That’s it. You’ve just documented something that would normally disappear into a Slack thread. The toolkit comes with design checkpoints, which are basically interactive checklists that keep accessibility top of mind as you work. If you want to go deeper, everything is documented. The repo has tutorials for every annotation type, deep dives on WCAG compliance, and guidance on avoiding common handoff friction. Check it out and contribute back if you find gaps. The bigger picture The Annotation Toolkit is a shift in how we think about collaboration. By embedding intent, accessibility, and clarity directly into Figma, GitHub is giving the developer-designer partnership a new foundation. It’s not about replacing conversations. It’s about making them more meaningful. When intent is clear, work flows faster, and the end result is better for everyone. The toolkit is actively maintained by GitHub staff and open to contributions. If you spot something that could be better, head over to github.com/github/annotation-toolkit and open an issue. Report bugs, suggest features, or contribute new annotation types. The team is actively looking for feedback on how you’re using it and what’s missing. 👉 Explore the toolkit on Figma at @GitHub or dive into the repository on GitHub. If you want to see it in action first, check out the walkthrough. Try it, contribute, and help shape the future of accessible, collaborative design. The post Level up design-to-code collaboration with GitHub’s open source Annotation Toolkit appeared first on The GitHub Blog. ​ Collaboration, Enterprise software, Annotation Toolkit, Figma The GitHub Blog

tech blog

How to write a great agents.md: Lessons from over 2,500 repositories

We recently released a new GitHub Copilot feature: custom agents defined in agents.md files. Instead of one general assistant, you can now build a team of specialists: a @docs-agent for technical writing, a @test-agent for quality assurance, and a @security-agent for security analysis. Each agents.md file acts as an agent persona, which you define with frontmatter and custom instructions. agents.md is where you define all the specifics: the agent’s persona, the exact tech stack it should know, the project’s file structure, workflows, and the explicit commands it can run. It’s also where you provide code style examples and, most importantly, set clear boundaries of what not to do. The challenge? Most agent files fail because they’re too vague. “You are a helpful coding assistant” doesn’t work. “You are a test engineer who writes tests for React components, follows these examples, and never modifies source code” does. I analyzed over 2,500 agents.md files across public repos to understand how developers were using agents.md files. The analysis showed a clear pattern of what works: provide your agent a specific job or persona, exact commands to run, well-defined boundaries to follow, and clear examples of good output for the agent to follow.  Here’s what the successful ones do differently. What works in practice: Lessons from 2,500+ repos My analysis of over 2,500 agents.md files revealed a clear divide between the ones that fail and the ones that work. The successful agents aren’t just vague helpers; they are specialists. Here’s what the best-performing files do differently: Put commands early: Put relevant executable commands in an early section: npm test, npm run build, pytest -v. Include flags and options, not just tool names. Your agent will reference these often. Code examples over explanations: One real code snippet showing your style beats three paragraphs describing it. Show what good output looks like. Set clear boundaries: Tell AI what it should never touch (e.g., secrets, vendor directories, production configs, or specific folders). “Never commit secrets” was the most common helpful constraint. Be specific about your stack: Say “React 18 with TypeScript, Vite, and Tailwind CSS” not “React project.” Include versions and key dependencies. Cover six core areas: Hitting these areas puts you in the top tier: commands, testing, project structure, code style, git workflow, and boundaries.  Example of a great agent.md file Below is an example for adding a documentation agent.md persona in your repo to .github/agents/docs-agent.md: — name: docs_agent description: Expert technical writer for this project — You are an expert technical writer for this project. ## Your role – You are fluent in Markdown and can read TypeScript code – You write for a developer audience, focusing on clarity and practical examples – Your task: read code from `src/` and generate or update documentation in `docs/` ## Project knowledge – **Tech Stack:** React 18, TypeScript, Vite, Tailwind CSS – **File Structure:** – `src/` – Application source code (you READ from here) – `docs/` – All documentation (you WRITE to here) – `tests/` – Unit, Integration, and Playwright tests ## Commands you can use Build docs: `npm run docs:build` (checks for broken links) Lint markdown: `npx markdownlint docs/` (validates your work) ## Documentation practices Be concise, specific, and value dense Write so that a new developer to this codebase can understand your writing, don’t assume your audience are experts in the topic/area you are writing about. ## Boundaries – ✅ **Always do:** Write new files to `docs/`, follow the style examples, run markdownlint – ⚠️ **Ask first:** Before modifying existing documents in a major way – 🚫 **Never do:** Modify code in `src/`, edit config files, commit secrets Why this agent.md file works well States a clear role: Defines who the agent is (expert technical writer), what skills it has (Markdown, TypeScript), and what it does (read code, write docs). Executable commands: Gives AI tools it can run (npm run docs:build and npx markdownlint docs/). Commands come first. Project knowledge: Specifies tech stack with versions (React 18, TypeScript, Vite, Tailwind CSS) and exact file locations. Real examples: Shows what good output looks like with actual code. No abstract descriptions. Three-tier boundaries: Set clear rules using always do, ask first, never do. Prevents destructive mistakes. How to build your first agent Pick one simple task. Don’t build a “general helper.” Pick something specific like: Writing function documentation Adding unit tests Fixing linting errors Start minimal—you only need three things: Agent name: test-agent, docs-agent, lint-agent Description: “Writes unit tests for TypeScript functions” Persona: “You are a quality software engineer who writes comprehensive tests” Copilot can also help generate one for you. Using your preferred IDE, open a new file at .github/agents/test-agent.md and use this prompt: Create a test agent for this repository. It should: – Have the persona of a QA software engineer. – Write tests for this codebase – Run tests and analyzes results – Write to “/tests/” directory only – Never modify source code or remove failing tests – Include specific examples of good test structure Copilot will generate a complete agent.md file with persona, commands, and boundaries based on your codebase. Review it, add in YAML frontmatter, adjust the commands for your project, and you’re ready to use @test-agent. Six agents worth building Consider asking Copilot to help generate agent.md files for the below agents. I’ve included examples with each of the agents, which should be changed to match the reality of your project.  @docs-agent One of your early agents should write documentation. It reads your code and generates API docs, function references, and tutorials. Give it commands like npm run docs:build and markdownlint docs/ so it can validate its own work. Tell it to write to docs/ and never touch src/.  What it does: Turns code comments and function signatures into Markdown documentation   Example commands: npm run docs:build, markdownlint docs/ Example boundaries: Write to docs/, never modify source code @test-agent This one writes tests. Point it at your test framework (Jest, PyTest, Playwright) and give it the command to run tests. The boundary

tech blog

How we’re making GitHub Copilot smarter with fewer tools

In VS Code, GitHub Copilot Chat can access hundreds of tools through the Model Context Protocol (MCP) that range from codebase analysis tools to Azure-specific utilities. But giving an agent too many tools doesn’t always make it smarter. Sometimes it just makes it slower.  If you’ve ever seen this spinner in VS Code, you’ve hit the limits of a model that’s trying to reason across too many tools at once. To fix that, we’ve built two new systems—embedding-guided tool routing and adaptive tool clustering—and we’re rolling out a reduced toolset that trims the default 40 built-in tools down to 13 core ones. Across benchmarks like SWE-Lancer and SWEbench-Verified with both GPT-5 and Sonnet 4.5, these changes improve success rates by 2-5 percentage points. In online A/B testing, it reduces response latency by an average of 400 milliseconds.   Too many tools impede agent intelligence    The default toolset in VS Code consists of about 40 built-in tools, ranging from general command-line utilities to specialized tools for Jupyter Notebooks. With MCP servers included, that number can grow into the hundreds. Often, MCP servers bring in so many tools that they can exceed the API limits of some models.   We’ve explored ways to filter down our toolset to provide only the tools most relevant to the user’s query, while not restricting the agent’s capabilities. Specifically, we needed to make sure we didn’t sacrifice the user’s experience to achieve lower latency.  To accomplish this, we designed a middle-ground approach: “virtual tools.” This includes functionally grouping similar tools under one “virtual tool” the chat agent can expand as needed. Think of these as directories that contain related tools. This gives the model a general sense of what’s available without flooding it with hundreds of tool names. It also reduces the cache miss rate we’d expect if the model searched for individual tools, since it’s likely that similar tools are used and activated together.   Applying lossless dynamic tool selection for MCP tools   Adaptive tool clustering   Initially we fed all the available tools into an LLM and asked it to group and summarize them. But this had two big issues:    We couldn’t control the number of groups created, and it sometimes exceeded model limits    It was extremely slow and incurred a huge token cost. The model would also sometimes ‘forget’ to categorize certain tools, forcing retries   To tackle this issue, we applied our internal Copilot embedding model optimized for semantic similarity tasks to generate embeddings for each tool and group them using cosine similarity. This clustering method allowed precise, stable, and reproducible groups. As an example, here is one possible grouping of embeddings for the GitHub MCP server’s tools in the embedding space:   We still use a model call to summarize each cluster, but this step is much faster and cheaper than asking the model to categorize everything from scratch. Tool embeddings and group summaries are cached locally, so recomputing them is comparatively cheap.   Context-guided tool selection   Once tools were grouped, we faced another problem: how does the model know which group to open without checking them all? We saw that, most of the time, the model would eventually find the right tool for its task. However, each call to a virtual tool still results in a cache miss, an extra round trip, and an opportunity for a small percentage of agent operations to fail.  For example, when the user says: “Fix this bug and merge it into the dev branch.”  The model often opens search tools, then documentation tools, then local Git tools, before finally realizing that it actually needs the merge tool inside the GitHub MCP tool group to complete the operation.  Each incorrect group lookup adds latency and overhead, even though the correct group is fairly obvious from the context.  To address this, we introduced Embedding-Guided Tool Routing. Before any tool group is expanded, the system compares the query embedding against vector representations of all tools (and their clusters), allowing it to pre-select the most semantically relevant candidates—even if they’re buried deep inside a group.  With context-aware routing, we can infer from the beginning that the model is very likely to need the merge tool inside the GitHub MCP tool group, and include it directly in its candidate set—eliminating unnecessary exploratory calls and significantly reducing latency and failure rates.  By surfacing only the most promising matches, we make the model’s search more targeted and reliable, while reducing redundant exploration.  Embedding-based selection (powered by the Copilot Embedding model)   We calculate the success of our embedding-based selection process via Tool Use Coverage, which measures how often the model already has the right tool visible when it needs it.  In benchmarks, the embedding-based approach achieved 94.5% Tool Use Coverage, outperforming both LLM-based selection (87.5%) and the default static tool list (69.0%).   Offline, this approach resulted in a 27.5% absolute improvement in coverage, clearly surpassing the LLM-based method while helping the agent reason faster and stay efficient.   Online testing shows the same pattern: only 19% of Stable tool calls were successfully pre-expanded using the old method, whereas 72% of Insiders tool calls were pre-expanded thanks to the embedding-based matching. This confirms that the gains observed offline are consistently reflected in real-world usage.  Less is more: shrinking the default toolset    Even without hitting the model limits that massive MCP servers can trigger, an oversized built-in toolset still degrades performance. In offline benchmarks, we observed a 2–5 percentage point decrease in resolution rate on benchmarks including SWE-Lancer when the agent had access to the full built-in toolset. Behaviorally, the agent ends up ignoring explicit instructions, using tools incorrectly, and calling tools that are unnecessary to the task at hand.   So, we trimmed the list. Based on tool usage statistics and performance data, we identified a core toolset of 13 essential tools. These tools encompass high-level repository structure parsing, file reading and editing, context searching, and terminal usage.   The remaining, non-core built-in tools are grouped into four virtual categories: Jupyter Notebook Tools, Web Interaction Tools, VS Code Workspace Tools, and Testing Tools. This way, the model sees the smaller core set up-front and can expand groups only if necessary. As a result, users with the shrunken toolset experience an average decrease of 190 milliseconds in TTFT (Time To First Token), and an average decrease of 400 milliseconds in TTFT (Time to Final Token, or time to complete model response). A smaller toolset enables the agent to be more effective: simpler reasoning, faster response times, and better performance.   Future directions: from tool selection to long-context reasoning   As MCP systems evolve, the challenge isn’t just picking the right tool—it’s reasoning across time, context, and interactions.    A truly intelligent model shouldn’t just react to queries; it should remember previous tool usage, infer intent from history, and plan multi-step actions over long sessions. In this sense, tool selection is an early form of long-context reasoning. The same mechanisms that help models route to the right tool today could, in the future, help them reason across thousands of turns helping them decide when to act, when

tech blog

Evolving GitHub Copilot’s next edit suggestions through custom model training

Editing code often involves a series of small but necessary changes ranging from refactors to fixes to cleanup and edge-case handling. In February, we launched next edit suggestions (NES), a custom Copilot model that predicts the next logical edit based on the code you’ve already written. Since launch, we’ve shipped several major model updates, including the newest release earlier this month.  In this post, we’ll look at how we built the original model, how we’ve improved it over time, what’s new, and what we’re building next.  Why edit suggestions are challenging  Predicting the next edit is a harder problem than predicting the next token. NES has to understand what you’re doing, why you’re doing it, and what you’ll likely do next. That means:  The model must respond quickly to keep up with your flow. It has to know when not to suggest anything (too many suggestions can break your focus). It must infer intent from local context alone without your explicit prompts.  It must integrate deeply with VS Code so suggestions appear exactly where you expect them. Frontier models didn’t meet our quality and latency expectations. The smaller ones were fast but produced low-quality suggestions, while the larger ones were accurate but too slow for an in-editor experience. To get both speed and quality, we needed to train a custom model.  NES isn’t a general-purpose chat model. It’s a low-latency, task-specific model that runs alongside the editor and responds in real time. It’s the result of aligning model training, prompting, and UX around a single goal: seamless editing inside the IDE. That required tight coordination between model training, prompt design, UX design, and the VS Code team—the model only works because the system was co-designed end-to-end. This “AI-native” approach where every part of the experience evolves together is very different from training a general-purpose model for any task or prompt. It’s how we believe AI features should be built: end to end, with the developer experience at the center.  How we trained  The hard part wasn’t the architecture; it was the data. We needed a model that could predict the next edit a developer might make, but no existing dataset captured real-time editing behavior.  Our first attempt used internal pull request data. It seemed reasonable: pull requests contain diffs, and diffs look like edits. But internal testing revealed limitations. The model behaved overly cautiously—reluctant to touch unfinished code, hesitant to suggest changes to the line a user was typing, and often chose to do nothing. In practice, it performed worse than a vanilla LLM.  That failure made the requirement clear: we needed data that reflected how developers actually edit code in the editor, not how code looks after review.  Pull request data wasn’t enough because it:  Shows only the final state, not the intermediate edits developers make along the way  Lacks temporal ordering, so the model can’t learn when changes happen  Contains almost no negative samples (cases where the correct action is “don’t edit”)  Misses abandoned edits, in-progress rewrites, and other common editing behavior  So we reset our approach and built a much richer dataset by performing a large-scale custom data collection effort that captured code editing sessions from a set of internal volunteers. We found data quality to be key at this stage: a smaller volume of high-quality edit data led to better models than those trained with a larger volume of data that was less curated.  Supervised fine-tuning (SFT) of a model on this custom dataset produced the first model to outperform the vanilla models. This initial model provided a significant lift to quality and served as a foundation for the next several NES releases.  Model refinement with reinforcement learning  After developing several successful NES models with SFT, we focused on two key limitations of our training approach:  SFT can teach the model what constitutes a good edit suggestion, but it cannot explicitly teach the model what makes an edit suggestion bad. SFT can effectively leverage labeled edit suggestions, but it cannot fully utilize the much larger number of unlabeled code samples. To address these two limitations, we turned to reinforcement learning (RL) techniques to further refine our model. Starting with the well-trained NES model from SFT, we optimized the model using a broader set of unlabeled data by designing a grader capable of accurately judging the quality of the model’s edit suggestions. This allows us to refine the model outputs and achieve higher model quality.  The key ideas in the grader design can be summarized as follows:  We use a large reasoning model with specific grading criteria. We routinely analyze model outputs to update the grading criteria, constantly searching for new qualities that indicate unhelpful edits. The grader should not only consider the correctness of the edit suggestion, but also strive to make the code diff displayed in the UI more user-friendly (easy to read). Continued post-training with RL has improved the model’s generalization capability. Specifically, RL extends training to unsupervised data, expanding the volume and diversity of data that we have available for training and removing the requirement that the ground truth next edit is known. This ensures that the training process consistently explores harder cases and prevents the model from collapsing into simple scenarios.  Additionally, RL allows us to define our preferences through the grader, enabling us to explicitly establish criteria for “bad edit suggestions.” This enables the trained model to better avoid generating bad edit suggestions when faced with out-of-distribution cases.  Lessons from training our latest custom NES model  Our most recent NES release builds on that foundation with improvements to data, prompts, and architecture:  Prompt optimization: NES runs many times per minute as you edit, so reducing the amount of context we send on each request has a direct impact on latency. We trimmed the prompt, reused more cached tokens between calls, and removed unneeded markup, which makes suggestions appear faster without reducing quality.  Data quality filtering: Used LLM-based graders to filter out ambiguous or low-signal samples in order to reduce unhelpful

tech blog

From Policy to Outcomes: Security, Sovereignty and Skills

Dell drives AI innovation with policy leadership, workforce development, and cutting-edge solutions transforming communities.   ​  ​Dell drives AI innovation with policy leadership, workforce development, and cutting-edge solutions transforming communities. Government Blog | Dell

tech blog

Humain Studios Spins Up 44,000 NPCs

Humain Studios uses AI and GPUs to turn a 33-year scan cleanup challenge into a one-day NPC creation pipeline.   ​  ​Humain Studios uses AI and GPUs to turn a 33-year scan cleanup challenge into a one-day NPC creation pipeline. Dell Pro Max Blog | Dell

tech blog

Reimagining AI: Discrete NPU Power with Dell Pro Max

Run large AI models locally with datacenter-class fidelity and predictable performance, without sending sensitive data to the cloud.   ​  ​Run large AI models locally with datacenter-class fidelity and predictable performance, without sending sensitive data to the cloud. Announcement Blog | Dell

tech blog

Storage for your AI containers: PowerScale and ObjectScale

Containers are the future of app development, but stateful vs stateless? Dell PowerScale & ObjectScale have you covered. Dive in!   ​  ​Containers are the future of app development, but stateful vs stateless? Dell PowerScale & ObjectScale have you covered. Dive in! PowerScale Blog | Dell

tech blog

Unlocking AI in Security: A View from the Trenches

Unlock AI’s potential in security! Discover how CTOs & CSOs can collaborate to harness AI safely and effectively. Read more!   ​  ​Unlock AI’s potential in security! Discover how CTOs & CSOs can collaborate to harness AI safely and effectively. Read more! PowerScale Blog | Dell

tech blog

Microsoft, NVIDIA and Anthropic announce strategic partnerships

Anthropic to scale Claude on Azure Anthropic to adopt NVIDIA architecture NVIDIA and Microsoft to invest in Anthropic Today Microsoft, NVIDIA and Anthropic announced new strategic partnerships. Anthropic is scaling its rapidly-growing Claude AI model on Microsoft Azure, powered by NVIDIA, which will broaden access to Claude and provide Azure enterprise customers with expanded model choice and new capabilities. Anthropic has committed to purchase $30 billion of Azure compute capacity and to contract additional compute capacity up to one gigawatt.   For the first time, NVIDIA and Anthropic are establishing a deep technology partnership to support Anthropic’s future growth. Anthropic and NVIDIA will collaborate on design and engineering, with the goal of optimizing Anthropic models for the best possible performance, efficiency, and TCO, and optimizing future NVIDIA architectures for Anthropic workloads. Anthropic’s compute commitment will initially be up to one gigawatt of compute capacity with NVIDIA Grace Blackwell and Vera Rubin systems.  Microsoft and Anthropic are also expanding their existing partnership to provide broader access to Claude for businesses. Customers of Microsoft Foundry will be able to access Anthropic’s frontier Claude models including Claude Sonnet 4.5, Claude Opus 4.1, and Claude Haiku 4.5. This partnership will make Claude the only frontier model available on all three of the world’s most prominent cloud services. Azure customers will gain expanded choice in models and access to Claude-specific capabilities.   Microsoft has also committed to continuing access for Claude across Microsoft’s Copilot family, including GitHub Copilot, Microsoft 365 Copilot, and Copilot Studio.  As part of the partnership, NVIDIA and Microsoft are committing to invest up to $10 billion and up to $5 billion respectively in Anthropic.   Anthropic co-founder and CEO Dario Amodei, Microsoft Chairman and CEO Satya Nadella, and NVIDIA founder and CEO Jensen Huang gathered to discuss the new partnerships: YouTube Video Click here to load media The post Microsoft, NVIDIA and Anthropic announce strategic partnerships appeared first on The Official Microsoft Blog. ​Anthropic to scale Claude on Azure Anthropic to adopt NVIDIA architecture NVIDIA and Microsoft to invest in Anthropic Today Microsoft, NVIDIA and Anthropic announced new strategic partnerships. Anthropic is scaling its rapidly-growing Claude AI model on Microsoft Azure, powered by NVIDIA, which will broaden access to Claude and provide Azure enterprise customers with expanded model choice and new capabilities. Anthropic… The post Microsoft, NVIDIA and Anthropic announce strategic partnerships appeared first on The Official Microsoft Blog.  Featured, The Official Microsoft Blog, AI, Anthropic, Microsoft Azure, NVIDIA The Official Microsoft Blog

tech blog

From idea to deployment: The complete lifecycle of AI on display at Ignite 2025

By now, most people would agree that AI is in the process of fundamentally changing how we work and solve problems. But this technology is still too often thought of as an addition to the work we do, rather than a fundamental part of it. AI is not something that you can just plop on the end of a finished product, like a cherry on top of a sundae. Instead, using AI responsibly and wisely means thinking through how it can be used most effectively at every layer, from the datacenter that powers AI functionality to the people and organizations that are benefiting from its capabilities. As we embark on another Microsoft Ignite, our company is empowering the complete lifecycle of AI, creating tools and solutions to drive the next generation of digital transformation for every organization and at every level of the work they do. We envision a future where organizations become Frontier Firms by using AI for unlocking creativity and innovation, allowing the next great ideas to surface. These are some of the major themes we are seeing with this year’s Ignite products and features: AI in the flow of human ambition At Microsoft, we believe that all great ideas start with human ambition, which can be accessed and unlocked using the capabilities in Microsoft 365 Copilot and an agent ecosystem. Work IQ amplifies your IQ. It’s the intelligence layer that enables Microsoft 365 Copilot and agents to know how you work, with whom you work and the content you collaborate on. Built on your data, memory and inference, it connects to the rich company knowledge in your emails, files, meetings and chats, plus your preferences, habits, work patterns and relationships. It allows Copilot to make connections, unlock insights and predict the next best action based on native integrations, not a patchwork of third-party connectors. And now, you can tap into the expertise of Work IQ with APIs to build agents tuned to your unique workflows and business needs. Work IQ also is powering many of the updates across Microsoft 365 Copilot announced at Ignite today. Ubiquitous innovation and intelligence In a Frontier Firm, there are makers in every room of the house. People on the frontlines are closest to the work problems that need to be solved. They can create agents to help them in their day-to-day work. How do AI agents know what to do with your data? Foundry IQ and Fabric IQ help AI agents understand what users are doing, bridge the gap between raw data and real-world business meaning and find the context to make decisions. Fabric IQ brings together analytical, time series and location-based data with your operational systems under one shared model tied to business meaning. This gives you a live, connected view of your business, so both people and AI can act in real time. If you are a customer who is already using Power BI for your business intelligence reporting, all of that pre-existing data modeling work will act as an immediate accelerant, giving your agents the unique context that defines how your business runs. Foundry IQ takes this further with a fully managed knowledge system designed to ground AI agents over multiple data sources — including Microsoft 365 (Work IQ), Fabric IQ, custom applications and the web. This single endpoint for knowledge has routing and intelligence built in, enabling higher-quality reasoning, safer actions and more value for builders. Microsoft Agent Factory is a program that brings these agent IQ layers together to help organizations build agents with confidence. With a single metered plan, customers can start building with IQ using Microsoft Foundry and Copilot Studio. They can deploy their agents anywhere, including Microsoft 365 Copilot, with no upfront licensing and provisioning required. Eligible organizations can also tap into hands-on support from top AI Forward Deployed Engineers and access tailored role-based training to boost AI fluency across teams. Observability at every layer By 2028, businesses are projected to have[1] 1.3 billion AI agents automating workflows. Most organizations don’t yet have a way to observe, secure or govern them — if not governed, AI agents are the new shadow IT. Microsoft Agent 365 enables you to observe, manage and secure your AI agents, whether the agents are created with Microsoft platforms, open-source frameworks or third-party platforms. It equips them with many of the same apps and protections as people, tailored to agent needs, saving IT time and effort on integrating agents into business processes. It includes the Microsoft security solutions Defender, Entra, Purview and Foundry Control Plane to protect and govern agents, productivity tools including Microsoft 365 apps and Work IQ to help people work more efficiently and Microsoft 365 admin center to manage agents. This is only a small selection of the many exciting features and updates we will be announcing at Ignite. As a reminder, you can view keynote sessions from Microsoft executives, including Judson Althoff, Scott Guthrie, Charles Lamanna, Asha Sharma and Ryan Roslansky, live or on-demand. Plus, you can get more on all these announcements by exploring the Book of News, the official compendium of all today’s news. Frank X. Shaw is responsible for defining and managing communications strategies worldwide, company-wide storytelling, product PR, media and analyst relations, executive communications, employee communications, global agency management and military affairs. Related: Partners leading the AI transformation: Microsoft Ignite 2025 recap [1] IDC Info Snapshot, sponsored by Microsoft, 1.3 Billion AI Agents by 2028, May 2025 #US53361825   The post From idea to deployment: The complete lifecycle of AI on display at Ignite 2025 appeared first on The Official Microsoft Blog. ​By now, most people would agree that AI is in the process of fundamentally changing how we work and solve problems. But this technology is still too often thought of as an addition to the work we do, rather than a fundamental part of it. AI is not something that you can just plop on… The post From idea to deployment: The complete lifecycle of AI on display at Ignite 2025 appeared first on The Official Microsoft Blog.  Featured, The Official Microsoft Blog, Book of News,

tech blog

Open Ethernet for AI: NVIDIA Spectrum-X with Dell SONiC

AI needs a better network. We’re building it with Dell Enterprise SONiC & NVIDIA Spectrum-X. See how we’re unlocking AI’s future.   ​  ​AI needs a better network. We’re building it with Dell Enterprise SONiC & NVIDIA Spectrum-X. See how we’re unlocking AI’s future. Announcement Blog | Dell

tech blog

Dell PowerScale with pNFS: Parallel Performance for AI

Unlock massive AI scalability with Dell PowerScale! Parallel NFS delivers faster data access, true linear scalability, and seamless deployment for your most demanding workloads.   ​  ​Unlock massive AI scalability with Dell PowerScale! Parallel NFS delivers faster data access, true linear scalability, and seamless deployment for your most demanding workloads. Announcement Blog | Dell

tech blog

Dell AI Data Platform Innovations Announced at SuperComputing 2025

Unlock massive AI scalability with Dell PowerScale and pNFS. Discover how parallel data access delivers faster throughput and client level scalability to feed GPUs for model training and ML/DL workloads.   ​  ​Unlock massive AI scalability with Dell PowerScale and pNFS. Discover how parallel data access delivers faster throughput and client level scalability to feed GPUs for model training and ML/DL workloads. AI Solutions Blog | Dell

Scroll to Top