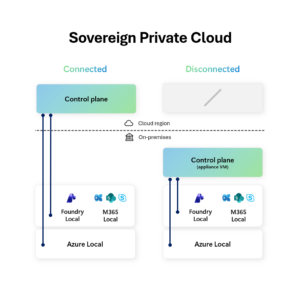
tech blog

When protections outlive their purpose: A lesson on managing defense systems at scale

To keep a platform like GitHub available and responsive, it’s critical to build defense mechanisms. A whole lot of them. Rate limits, traffic controls, and protective measures spread across multiple layers of infrastructure. These all play a role in keeping the service healthy during abuse or attacks. We recently ran into a challenge: Those same protections can quietly outlive their usefulness and start blocking legitimate users. This is especially true for protections added as emergency responses during incidents, when responding quickly means accepting broader controls that aren’t necessarily meant to be long-term. User feedback led us to clean up outdated mitigations and reinforced that observability is just as critical for defenses as it is for features. We apologize for the disruption. We should have caught and removed these protections sooner. Here’s what happened. What users reported We saw reports on social media from people getting “too many requests” errors during normal, low-volume browsing, such as when following a GitHub link from another service or app, or just browsing around with no obvious pattern of abuse. Users encountered a “Too many requests” error during normal browsing. These were users making a handful of normal requests hitting rate limits that shouldn’t have applied to them. What we found Investigating these reports, we discovered the root cause: Protection rules added during past abuse incidents had been left in place. These rules were based on patterns that had been strongly associated with abusive traffic when they were created. The problem is that those same patterns were also matching some logged-out requests from legitimate clients. These patterns are combinations of industry-standard fingerprinting techniques alongside platform-specific business logic — composite signals that help us distinguish legitimate usage from abuse. But, unfortunately, composite signals can occasionally produce false positives. The composite approach did provide filtering. Among requests that matched the suspicious fingerprints, only about 0.5–0.9% were actually blocked; specifically, those that also triggered the business-logic rules. Requests that matched both criteria were blocked 100% of the time. Not all fingerprint matches resulted in blocks — only those also matching business logic patterns. The overall impact was small but consistent; however, for the customers who were affected, we recognize that any incorrect blocking is unacceptable and can be disruptive. To put all of this in perspective, the following shows the false-positive rate relative to total traffic. False positives represented roughly 0.003-0.004% of total traffic. Although the percentage was low, it still meant that real users were incorrectly blocked during normal browsing, which is not acceptable. The chart below zooms in specifically on this false-positive pattern over time. In the hour before cleanup, approximately 3-4 requests per 100,000 (0.003-0.004%) were incorrectly blocked. This is a common challenge when defending platforms at scale. During active incidents, you need to respond quickly, and you accept some tradeoffs to keep the service available. The mitigations are correct and necessary at that moment. Those emergency controls don’t age well as threat patterns evolve and legitimate tools and usage change. Without active maintenance, temporary mitigations become permanent, and their side effects compound quietly. Tracing through the stack The investigation itself highlighted why these issues can persist. When users reported errors, we traced requests across multiple layers of infrastructure to identify where the blocks occurred. To understand why this tracing is necessary, it helps to see how protection mechanisms are applied throughout our infrastructure. We’ve built a custom, multi-layered protection infrastructure tailored to GitHub’s unique operational requirements and scale, building upon the flexibility and extensibility of open-source projects like HAProxy. Here’s a simplified view of how requests flow through these defense layers (simplified to avoid disclosing specific defense mechanisms and to keep the concepts broadly applicable): Each layer has legitimate reasons to rate-limit or block requests. During an incident, a protection might be added at any of these layers depending on where the abuse is best mitigated and what controls are fastest to deploy. The challenge: When a request gets blocked, tracing which layer made that decision requires correlating logs across multiple systems, each with different schemas. In this case, we started with user reports and worked backward: User reports provided timestamps and approximate behavior patterns. Edge tier logs showed the requests reaching our infrastructure. Application tier logs revealed 429 “Too Many Requests” responses. Protection rule analysis ultimately identified which rules matched these requests. The investigation took us from external reports to distributed logs to rule configurations, demonstrating that maintaining comprehensive visibility into what’s actually blocking requests and where is essential. The lifecycle of incident mitigations Here’s how these protections outlived their purpose: Each mitigation was necessary when added. But the controls where we didn’t consistently apply lifecycle management (setting expiration dates, conducting post-incident rule reviews, or monitoring impact) became technical debt that accumulated until users noticed. What we did We reviewed these mitigations, analyzing what each one was blocking today versus what it was meant to block when created. We removed the rules that were no longer serving their purpose, and kept protections against ongoing threats. What we’re building Beyond the immediate fix, we’re improving the lifecycle management of protective controls: Better visibility across all protection layers to trace the source of rate limits and blocks. Treating incident mitigations as temporary by default. Making them permanent should require an intentional, documented decision. Post-incident practices that evaluate emergency controls and evolve them into sustainable, targeted solutions. Defense mechanisms – even those deployed quickly during incidents – need the same care as the systems they protect. They need observability, documentation, and active maintenance. When protections are added during incidents and left in place, they become technical debt that quietly accumulates. Thanks to everyone who reported issues publicly! Your feedback directly led to these improvements. And thanks to the teams across GitHub who worked on the investigation and are building better lifecycle management into how we operate. Our platform, team, and community are better together! The post When protections outlive their purpose: A lesson on managing defense systems at scale appeared first on The GitHub Blog.

tech blog

Building an agentic memory system for GitHub Copilot

Our vision is to evolve GitHub Copilot into an ecosystem of agents that collaborate across the entire development lifecycle from coding and code review to security, debugging, deployment, and maintenance. To unlock the full potential of multi-agent workflows, we need to move beyond isolated interactions—that start from scratch each session—and toward a cumulative knowledge base that grows with every use.  Cross-agent memory allows agents to remember and learn from experiences across your development workflow, without relying on explicit user instructions. Each interaction teaches Copilot more about your codebase and conventions, making it increasingly effective over time. For example, if Copilot coding agent learns how your repository handles database connections as it’s fixing a security vulnerability, Copilot code review can then use that knowledge to spot inconsistent patterns in future pull requests. Or if Copilot code review notices that certain files must stay synchronized, in the future Copilot coding agent will automatically update them together when generating new code.  Where memory works today in GitHub Copilot (public preview) Copilot’s new memory system is available in public preview, starting with Copilot coding agent, Copilot CLI, and Copilot code review for all paid Copilot plans, with other agents to follow shortly (learn about how it works in our Docs). It’s off by default and fully opt-in, so you decide when and where Copilot should start learning from your workflows. You can turn on memory in your GitHub Copilot settings. Learn how to enable memory in our Docs > The challenge: What to remember and when to forget Our agents continuously improve at extracting the context needed for specific tasks. The core challenge for memory systems isn’t about information retrieval, but ensuring that any stored knowledge remains valid as code evolves across branches and time.  In practice, this means a memory system must handle changes to code, abandoned branches, and conflicting observations—all while ensuring that agents only act on information that’s relevant to the current task and code state. For example, a logging convention observed in one branch may later be modified, superseded, or never merged at all. One option would be to implement an offline curation service to deduplicate, resolve conflicts, track branch status, and expire stale information. At GitHub’s scale, however, such an approach would introduce significant engineering complexity and LLM costs, while still requiring mechanisms to reconcile changes at read time. We started by exploring a simpler, more efficient approach. Our solution: just-in-time verification Information retrieval is an asymmetrical problem: It’s hard to solve, but easy to verify. By using real-time verification, we gain the power of pre-stored memories while avoiding the risk of outdated or misleading information. Instead of offline memory curation, we store memories with citations: references to specific code locations that support each fact. When an agent encounters a stored memory, it verifies the citations in real-time, validating that the information is accurate and relevant to the current branch before using it. This verification boils down to a small number of simple read operations, adding no significant latency to agent sessions in our testing. Memory creation as a tool call We implemented memory creation as a tool that agents can invoke when they discover something that’s likely to have actionable implications for future tasks. How Copilot agents store learnings worth remembering as they carry out their tasks. Consider this example: While reviewing a pull request from an experienced developer, Copilot code review discovers that API version tracking must stay synchronized across different parts of a codebase. It might encounter these three updates in the same pull request: In src/client/sdk/constants.ts: export const API_VERSION = “v2.1.4”; In server/routes/api.go: const APIVersion = “v2.1.4” In docs/api-reference.md: Version: v2.1.4 In response, Copilot code review can invoke the memory storage tool to create a memory like this: { subject: “API version synchronization”, fact: “API version must match between client SDK, server routes, and documentation.”, citations: [“src/client/sdk/constants.ts:12”, “server/routes/api.go:8”, “docs/api-reference.md:37”], reason: “If the API version is not kept properly synchronized, the integration can fail or exhibit subtle bugs. Remembering these locations will help ensure they are kept syncronized in future updates.” } The result: The next time an agent updates the API version in any of these locations, it will see this memory and realize that it must update the other locations too, preventing a versioning mismatch that could break integrations. Similarly, if an inexperienced developer opens a pull request that updates only one of these locations, Copilot code review will flag the omission and suggest the missing updates, automatically transferring knowledge from a more experienced team member to a newer one. 💥 Memory usage Retrieval When an agent starts a new session, we retrieve the most recent memories for the target repository and include them in the prompt. Future implementations will enable additional retrieval techniques, such as a search tool and weighted prioritization.  How Copilot enriches agent prompts with memories from previous tasks. Verification Before applying any memory, the agent is prompted to verify its accuracy and relevance by checking the cited code locations. If the code contradicts the memory, or if the citations are invalid (e.g. point to nonexistent locations), the agent is encouraged to store a corrected version of the memory reflecting the new evidence. If the citations check out and the memory is deemed useful, the agent is encouraged to store it again in order to refresh its timestamp. Privacy and security It’s important to note that memories are tightly scoped. Memories for a given repository can only be created in response to actions taken within that repository by contributors with write permissions, and can only be used in tasks on that same repository initiated by users with read permissions. Much like the source code itself, memories about a repository stay within that repository, ensuring privacy and security. Cross-agent memory sharing The full power of our memory system emerges as different Copilot agents learn from one another.  Copilot code review discovers a logging convention while reviewing a pull request: “Log file names should follow pattern ‘app-YYYYMMDD.log’. Use Winston for logging with

tech blog

Context windows, Plan agent, and TDD: What I learned building a countdown app with GitHub Copilot

In our last Rubber Duck Thursdays stream of 2025, I wanted to build something celebratory. Something that captures what Rubber Duck Thursdays is all about: building together, learning from mistakes, and celebrating everyone who tunes in from across the world.  Along the way, I picked up practical patterns for working with AI that you can apply to your own projects, whether you’re building a countdown app or something entirely different. From managing context windows to avoid cluttered conversations, to using the Plan agent for requirement discovery, to catching edge cases through test-driven development with Copilot. And… why world maps are harder than they look. 👀 See the full stream below. 👇 Starting simple: The basic countdown Countdown timers are a straightforward concept. Days countdown to hours. Minutes countdown to seconds. But sometimes it’s the simple ideas that allow us to be our most creative. I figured I’d use this as an opportunity to use Copilot in a spec or requirements-driven approach, to build a countdown app that brought anticipation and displayed fireworks as it turned to the new year.  💡What is spec-driven development? Instead of coding first and writing docs later, spec-driven development, you guessed it, starts with a spec. This is a contract for how your code should behave and becomes the source of truth your tools and AI agents use to generate, test, and validate code. The result is less guesswork, fewer surprises, and higher-quality code. Get started with our open source Spec Kit > Fortunately, software development is an iterative process and this livestream embraced that fully. While some requirements were well-defined, others evolved in real time, shaped by suggestions from our livestream audience. Custom agents like the Plan agent helped bridge the gap, turning ambiguous ideas into structured plans I could act on. So let’s start at the very beginning, setting up the project. I generated a new workspace with GitHub Copilot, using a very specific prompt. The prompt explained that we’re building a countdown app and that I wanted to use Vite, TypeScript, and Tailwind CSS v4. It also explained some of the requirements including the dark theme, centred layout, large bold digits with subtle animation, target midnight on January, 2026 by default, with some room for customizations. #new 1. Create a new workspace for a New Year countdown app using Vite, TypeScript, and Tailwind CSS v4. **Setup requirements:** – Use the @tailwindcss/vite plugin (Tailwind v4 style) – Dark theme by default (zinc-900 background) – Centered layout with the countdown as the hero element **Countdown functionality:** Create a `countdown.ts` module with: – A `CountdownTarget` type that has `{ name: string, date: Date }` so we can later customize what we’re counting down to – A `getTimeRemaining(target: Date)` function returning `{ days, hours, minutes, seconds, total }` – A `formatTimeUnit(n: number)` helper that zero-pads to 2 digits – Default target: midnight on January 1st of NEXT year (calculate dynamically from current date) **Display:** – Large, bold countdown digits (use tabular-nums for stable width) – Labels under each unit (Days, Hours, Minutes, Seconds) – Subtle animation when digits change (CSS transition) – Below the countdown, show: “until [target.name]” (e.g., “until 2026”) **Architecture:** – `src/countdown.ts` – pure logic, no DOM – `src/main.ts` – sets up the interval and updates the DOM – Use `requestAnimationFrame` or `setInterval` at 1 second intervals – Export types so they’re reusable Keep it simple and clean—this is the foundation we’ll build themes on top of. What I love about the “generate new workspace” feature is that Copilot generated custom instruction files for me, automatically capturing my requirements, including the countdown app, Vite, TypeScript, and dark theme. It was all documented before writing a single line of code. Within minutes, I had a working countdown. Days, hours, minutes, and seconds ticking down to 2026. While it worked, it wasn’t visually exciting. In fairness, I hadn’t specified any design or theme preferences in my initial prompt. So it was time to iterate and make it more interesting. The community suggestion that steered our course During the stream, viewers were joining from India, Nigeria, Italy, the United States (the list goes on!); developers from around the world, coming together to learn. One person in the chat made a suggestion that adjusted what we’d do next: What about time zones? It wasn’t a requirement I’d expected to work on during the stream, so I didn’t have a clear plan of how it would work. Maybe there is a globe that you could spin to select timezones. Maybe there was a world map with a time travel theme. That’s a lot of maybes. My requirements were vague, which was where I turned to the Plan agent. Plan agent: The questions I hadn’t thought to ask I’ve been using Plan agent more deliberately lately, especially when I feel that my  requirements aren’t fully defined. The Plan agent doesn’t create a plan based on my initial prompt, it asks clarifying questions that can reveal edge cases you may not have considered. I gave it my rough idea: interactive time zone selector, time travel theme, animate between zones, maybe a world map. The Plan agent came back with questions that made me think: Question Why it mattered Should the circular dial be primary with the world map as secondary, or vice versa? I hadn’t decided the visual hierarchy What happens on mobile: dropdown fallback or touch-friendly scroll? I was only thinking of a desktop implementation for this initial version. Mobile could be a future requirement. When a time zone passes midnight, show “already celebrating” with confetti, or a timer showing how long since midnight? I wanted the celebration, not a reverse countdown. I wasn’t clear on my requirements. Would there be subtle audio feedback when spinning the dial, or visual only? Bringing audio into the app was scope creep, but it could be a future requirement. This is the beauty of working with AI in this way. The Plan agent makes you think, potentially asking a clarifying question and offering

tech blog

AI-supported vulnerability triage with the GitHub Security Lab Taskflow Agent

Triaging security alerts is often very repetitive because false positives are caused by patterns that are obvious to a human auditor but difficult to encode as a formal code pattern. But large language models (LLMs) excel at matching the fuzzy patterns that traditional tools struggle with, so we at the GitHub Security Lab have been experimenting with using them to triage alerts. We are using our recently announced GitHub Security Lab Taskflow Agent AI framework to do this and are finding it to be very effective. 💡 Learn more about it and see how to activate the agent in our previous blog post. In this blog post, we’ll introduce these triage taskflows, showcase results, and  share tips on how you can develop your own—for triage or other security research workflows.  By using the taskflows described in this post, we quickly triaged a large number of code scanning alerts and discovered many (~30) real-world vulnerabilities since August, many of which have already been fixed and published. When triaging the alerts, the LLMs were only given tools to perform basic file fetching and searching. We have not used any static or dynamic code analysis tools other than to generate alerts from CodeQL. While this blog post showcases how we used LLM taskflows to triage CodeQL queries, the general process creates automation using LLMs and taskflows. Your process will be a good candidate for this if: You have a task that involves many repetitive steps, and each one has a clear and well-defined goal. Some of those steps involve looking for logic or semantics in code that are not easy for conventional programming to identify, but are fairly easy for a human auditor to identify. Trying to identify them often results in many monkey patching heuristics, badly written regexp, etc. (These are potential sweet spots for LLM automation!) If your project meets those criteria, then you can create taskflows to automate these sweet spots using LLMs, and use MCP servers to perform tasks that are well suited for conventional programming. Both the seclab-taskflow-agent and seclab-taskflows repos are open source, allowing anyone to develop LLM taskflows to perform similar tasks. At the end of this blog post, we’ll also give some development tips that we’ve found useful. Introduction to taskflows Taskflows are YAML files that describe a series of tasks that we want to do with an LLM. In this way, we can write prompts to complete different tasks and have tasks that depend on each other. The seclab-taskflow-agent framework takes care of running the tasks one after another and passing the results from one task to the next. For example, when auditing CodeQL alert results, we first want to fetch the code scanning results. Then, for each result, we may have a list of tasks that we need to check. For example, we may want to check if an alert can be reached by an untrusted attacker and whether there are authentication checks in place. These become a list of tasks we specify in a taskflow file. We use tasks instead of one big prompt because LLMs have limited context windows, and complex, multi-step tasks often are not completed properly. Some steps are frequently left out, so having a taskflow to organize the task avoids these problems. Even with LLMs that have larger context windows, we find that taskflows are useful to provide a way for us to control and debug the task, as well as to accomplish bigger and more complex tasks. The seclab-taskflow-agent can also perform a batch “for loop”-style task asynchronously. When we audit alerts, we often want to apply the same prompts and tasks to every alert, but with different alert details. The seclab-taskflow-agent allows us to create templated prompts to iterate through the alerts and replace the details specific to each alert when running the task. Triaging taskflows from a code scanning alert to a report The GitHub Security Lab periodically runs a set of CodeQL queries against a selected set of open source repositories. The process of triaging these alerts is usually fairly repetitive, and for some alerts, the causes of false positives are usually fairly similar and can be spotted easily.  For example, when triaging alerts for GitHub Actions, false positives often result from some checks that have been put in place to make sure that only repo maintainers can trigger a vulnerable workflow, or that the vulnerable workflow is disabled in the configuration. These access control checks come in many different forms without an easily identifiable code pattern to match and are thus very difficult for a static analyzer like CodeQL to detect. However, a human auditor with general knowledge of code semantics can often identify them easily, so we expect an LLM to be able to identify these access control checks and remove false positives. Over the course of a couple of months, we’ve tested our taskflows with a few CodeQL rules using mostly Claude Sonnet 3.5. We have identified a number of real, exploitable vulnerabilities. The taskflows do not perform an “end-to-end” analysis, but rather produce a bug report with all the details and conclusions so that we can quickly verify the results. We did not instruct the LLM to validate the results by creating an exploit nor provide any runtime environment for it to test its conclusion. The results, however, remain fairly accurate even without an automated validation step and we were able to remove false positives in the CodeQL queries quickly. The rules are chosen based on our own experience of triaging these types of alerts and whether the list of tasks can be formulated into clearly defined instructions for LLMs to consume.  General taskflow design Taskflows generally consist of tasks that are divided into a few different stages. In the first stage, the tasks collect various bits of information relevant to the alert. This information is then passed to an auditing stage, where the LLM looks for common causes of false positives from our own experience of triaging alerts.

tech blog

Help shape the future of open source in Europe

At GitHub, we believe that open source is a primary driver of innovation, security, and economic competitiveness. The European Union is currently at a pivotal moment in defining how it supports this ecosystem, and it wants to hear from you, the builders. The European Commission is planning to adopt an open source strategy called “Towards European Open Digital Ecosystems“. This initiative is not about passing new laws; instead the EU is looking to develop a strategic framework and funding measures to help the EU open source sector scale up and become more competitive. This effort aims to strengthen the EU’s technological sovereignty by supporting open source software and hardware across critical sectors like AI, cloud computing, and cybersecurity.  We’ve been advocating for this kind of support for a long time. For instance, we previously highlighted the need for a European Sovereign Tech Fund to invest in the maintenance of critical basic open source technologies such as libraries or programming languages. This new strategy is a chance to turn those kinds of ideas into official EU policy. You can read GitHub’s response to the European Commission here.  Brand new data from GitHub Innovation Graph shows that the EU is a global open source powerhouse: There are now almost 25 million EU developers on GitHub, who made over 155 million contributions to public projects in the last year alone. The EU wants to help European companies turn open source projects into successful businesses, which is an admirable goal with plenty of opportunities to achieve it. For example, the EU can create better conditions for open source businesses by making it easier for them to participate in public procurement and access the growth capital they need to turn great code into sustainable products. By supporting the business models and infrastructure that surround it, the EU can turn its massive developer talent into long-term economic leadership. It is important to understand, though, that not all open source projects can be turned into commercial products—and that commercialization is not every developer’s goal. A successful EU open source policy should also support the long-term sustainability of non-commercially produced open source components that benefit us all. That is why the European Commission needs to hear the full spectrum of experiences from the community—from individual maintainers, startups, companies, and researchers. Over 900 people have already shared their views, and we encourage you to join them. The European Commission is specifically looking for responses covering these five topics: Strengths and weaknesses: What is standing in the way of open source adoption and sustainable open source contributions in the EU? Added value: How does open source benefit the public and private sectors? Concrete actions: What should the EU do to support open source? Priority areas: Which technologies (e.g., AI, IoT, or Cloud) should be the focus? Sector impact: In which industries (e.g., automotive or manufacturing) could open source increase competitiveness and cybersecurity? How to Participate The “Call for Evidence” is your opportunity to help shape the future tech policy of the EU. It only takes a few minutes to provide your perspective. Submit your feedback by February 3 (midnight CET). Your voice is essential to ensuring that the next generation of European digital policy is built with the needs of real developers in mind. At GitHub Developer Policy, we are always open to feedback from developers. Please do not hesitate to contact us as well. The post Help shape the future of open source in Europe appeared first on The GitHub Blog. ​ News & insights, Policy, GitHub Policy The GitHub Blog

tech blog

Power agentic workflows in your terminal with GitHub Copilot CLI

Since GitHub Copilot CLI launched in public preview in September 2025, we’ve been shipping frequent regular updates and advancements.. Below, we’ll show you what makes Copilot CLI so special, why it’s great to have an agentic AI assistant right in your terminal, and how we’re building the Copilot CLI to connect more broadly to the rest of the GitHub Copilot ecosystem. Note: This blog is based on a GitHub Universe 2025 presentation. Watch below to see the functionality in action. 👇 Bringing the CLI to where you work If you use GitHub Copilot in VS Code or in a similar IDE, consider how often you spend your entire working day in the IDE, trying to avoid doing anything in any other working environment. We kept this thought top of mind when we conceptualized the GitHub Copilot CLI. Developers spend time using ssh to connect to servers, debug things in containers, triage issues on github.com, manage CI/CD pipelines, and write deployment scripts. There’s a lot of work that doesn’t neatly map into an individual IDE or even a multipurpose code editor like VS Code.  To make sure that we brought the GitHub CLI to developers where they already are, it made sense to go through the terminal. After all, the terminal transcends all the different applications on your computer and, in the right hands, is where you can accomplish any task with fine-grained control. Bringing GitHub Copilot into the CLI and giving it access to the broader GitHub ecosystem lets you spend more time getting your work done, and less time hunting down man pages and scouring through documentation to learn how to do something. Showcasing the GitHub CLI functionality Often, the first step with a project is getting up to speed on it. Let’s consider an example where you’re filling in for a friend on a project, but you don’t know anything about it—you don’t know the codebase, the language, or even the framework. You’ve received a request to update a feedback form because the UI elements are not laid out correctly. Specifically, the Submit Feedback button overlaps the form itself, obscuring some fields. Whoever submitted the bug included a screenshot showing the UI error. To get started, you can launch the GitHub CLI and ask it to clone the repository. Clone the feedback repo and set us up to run it After sending this prompt, Copilot will get you everything you need: It will reference the documentation associated with the repository and figure out any dependencies you need in order to successfully run it. It’s a fast way to get started, even if you’re not familiar with the dependencies required. Copilot will prompt you before running any commands to make sure that it has permission to do so. It will tell you what it’s doing and make sure that you authorize any commands before it runs them. Now let’s say that your repository is set up and you go to run the server, but you receive an error that the port is already in use. This can be a workflow killer. You know that there are commands you can run in the terminal to identify the process using the port and safely shut it down, but you might not remember the exact syntax to do so. To make this much easier, you can just hand the task over to Copilot. What is using port 3000? Without you needing to look up the commands, Copilot can determine the PID using the port. You can then either kill the process yourself or hand that task over to Copilot so you can focus on other tasks. Find and kill the process on port 3000 Continuing with our example, you now have the repository up and running and can verify the error with the Submit Feedback button. However, you don’t want to look through all of the code files to try and find what the bug might be. Why not have Copilot take a look first and see if it can identify any obvious issues? Copilot can analyze images, so you can use the image supplied in the bug report. Upload the screenshot showing the error to the repository, and ask Copilot if it has any ideas on how to fix the bug. Fix the big shown in @FIX-THIS.PNG Copilot will attempt to find and fix the issue, supplying a list of suggested changes. You can then review the changes and decide whether or not to have Copilot automatically apply the fixes. And we’re able to do all of this in the terminal thanks to the GitHub CLI. However, before uploading these changes to the repository, the team has very strict accessibility requirements. You might not be familiar with what these are, but in this example, the team has a custom agent that defines them. It has all the right MCP tools to check on the guardrails, so you can leverage the agent to do an accessibility review of any proposed changes. /agent This command provides a list of available custom agents, so you can select the appropriate one you want to use. Once you select the appropriate agent, simply ask it to look over the proposed changes. Review our changes This prompt sets the coding agent to work, looking at your changes. If it finds any issues, it will let you know and suggest updates to make sure your changes are aligned with its instructions. This can be immensely powerful with the appropriate agents to leverage to provide checks on your code. Finally, let’s say you want to know if there are any open issues that map to the work that you’ve done, but you don’t want to manually search through all of the open issues. Luckily, Copilot CLI ships with the GitHub MCP server, so you can look up anything on the GitHub repository without needing to manually go to github.com. Are there any open issues that map to the work we’re doing? The GitHub MCP server will then go

tech blog

Build an agent into any app with the GitHub Copilot SDK

Building agentic workflows from scratch is hard.  You have to manage context across turns, orchestrate tools and commands, route between models, integrate MCP servers, and think through permissions, safety boundaries, and failure modes. Even before you reach your actual product logic, you’ve already built a small platform.  GitHub Copilot SDK (now in technical preview) removes that burden. It allows you to take the same Copilot agentic core that powers GitHub Copilot CLI and embed it in any application.   This gives you programmatic access to the same production-tested execution loop that powers GitHub Copilot CLI. That means instead of wiring your own planner, tool loop, and runtime, you can embed that agentic loop directly into your application and build on top of it for any use case.  You also get Copilot CLI’s support for multiple AI models, custom tool definitions, MCP server integration, GitHub authentication, and real-time streaming. How to get started We’re starting with support for Node.js, Python, Go, and .NET. You can use your existing GitHub Copilot subscription or bring your own key.   The github/copilot-sdk repository includes:   Setup instructions  Starter examples  SDK references for each supported language  A good first step is to define a single task like updating files, running a command, or generating a structured output and letting Copilot plan and execute steps while your application supplies domain-specific tools and constraints.  Here’s a short code snippet to preview how you can call the SDK in TypeScript:  import { CopilotClient } from “@github/copilot-sdk”; const client = new CopilotClient(); await client.start(); const session = await client.createSession({ model: “gpt-5”, }); await session.send({ prompt: “Hello, world!” }); Visit github/copilot-sdk to start building.   What’s new in GitHub Copilot CLI   Copilot CLI lets you plan projects or features, modify files, run commands, use custom agents, delegate tasks to the cloud, and more, all without leaving your terminal.  Since we first introduced it, we’ve been expanding Copilot’s agentic workflows so it:  Works the way you do with persistent memory, infinite sessions, and intelligent compaction.  Helps you think with explore, plan, and review workflows where you can choose which model you want at each step.  Executes on your behalf with custom agents, agent skills, full MCP support, and async task delegation.  How does the SDK build on top of Copilot CLI?  The SDK takes the agentic power of Copilot CLI (the planning, tool use, and multi-turn execution loop) and makes it available in your favorite programming language. This makes it possible to integrate Copilot into any environment. You can build GUIs that use AI workflows, create personal tools that level up your productivity, or run custom internal agents in your enterprise workflows.   Our teams have already used it to build things like:  YouTube chapter generators  Custom GUIs for their agents  Speech-to-command workflows to run apps on their desktops  Games where you can compete with AI  Summarizing tools  And more!  Think of the Copilot SDK as an execution platform that lets you reuse the same agentic loop behind the Copilot CLI, while GitHub handles authentication, model management, MCP servers, custom agents, and chat sessions plus streaming. That means you are in control of what gets built on top of those building blocks. Start building today! Visit the SDK repository to get started. The post Build an agent into any app with the GitHub Copilot SDK appeared first on The GitHub Blog. ​ AI & ML, Company news, GitHub Copilot, News & insights, GitHub Copilot CLI, GitHub Copilot SDK, SDK The GitHub Blog

tech blog

A cheat sheet to slash commands in GitHub Copilot CLI

Do you ever feel like you’re spending more time moving between different tools than you are writing code? If you thrive in the terminal and want faster, more predictable ways to run tests, fix code, and manage context, Copilot CLI slash commands give you that control without breaking your flow. You can use slash commands to perform a variety of tasks like configuring which AI model to use or setting up an MCP server, or even sharing your session externally. Slash commands offer fast, repeatable actions without needing to craft a new prompt each time. TL;DR: See all the slash commands and what they do at the bottom of this post. 😉 What are slash commands? A slash command is a simple instruction, like /clear or /session, that tells Copilot exactly what you want to do. They are prefixed with a / and instantly trigger Copilot to carry out context-aware actions. To start using slash commands , open Copilot CLI and type / to see a list of available commands. How to use slash commands Type / in the Copilot CLI to see a list of available slash commands and their descriptions. You can also use /help to get more details about what each command does and how to use it. For instructions and examples, keep scrolling! Start here (two minutes) Open Copilot CLI Type /help to see available commands Run /clear to reset context Run /cwd to confirm Copilot is scoped to the right directory.  You can jump to the sections below based on what you’re trying to do.  Learn more in our docs > In addition to Copilot CLI, you can use slash commands across Copilot Chat and with agent mode, too. Why use slash commands? As developers, we want tools that work fast in the terminal. Slash commands in Copilot CLI do just that. Instead of writing a new prompt for each task, you use quick, explicit, and repeatable commands directly in your workflow. In practice, they help with: Speed and predictability: With slash commands, Copilot’s actions are more transparent and predictable. Unlike natural language prompts, which can be interpreted in different ways, slash commands always trigger the same response. This removes guesswork because you always know what you’re going to get, instantly.  Productivity: Before slash commands, you might have copied and pasted code, written long prompts, or switched back and forth between tools. Now you can clean up errors, run tests, and get code explanations right from the CLI, without leaving your terminal. Clarity and security: Commands like /add-dir and /list-dirs give clear boundaries for file access and create an auditable trail, which is essential for teams working in sensitive environments. This eliminates uncertainty about what’s happening behind the scenes, reduces the risk of accidental data exposure, and helps teams maintain control in sensitive environments.  Better accessibility: Slash commands fit seamlessly into keyboard-driven and accessible workflows. Commands like /help provide an instant overview of available actions, while /list-dirs or /list-files let users browse without navigating complex interfaces. These commands enable users who rely on keyboard shortcuts or assistive technologies to quickly discover and use Copilot features. Trust and compliance: Slash commands enhance trust by making every Copilot action explicit and traceable. For example, teams can use /add-dir to grant Copilot access to a specific directory. This ensures that sensitive files stay protected. With slash commands like /session or /usage, teams can manage tool access, monitor activity, and stay compliant. Custom workflows and extensibility: As support for slash commands expands, you can tailor Copilot to work with your own tasks and automations. Delegate pull requests, switch agents, or connect to CI/CD pipelines, all from the CLI, with commands like /delegate, /agent, and /mcp. Think of slash commands as explicit shortcuts for things you already do. There’s a lot you can do with Copilot CLI, and slash commands make the process easier. Useful Copilot CLI slash commands for your everyday workflow Below are the most commonly used slash commands, grouped by what you typically need to control in your workflows: context, scope, configuration, and collaboration. 💡 Tip: If you only remember three commands, start with /clear, /cwd, and /model. These give you immediate control over context, scope, and output quality.  Session management commands /clear: Delete the current session’s conversation history. Copilot accumulates context as you work. This inherited context can muddy suggestions when you have too much of it, or when you’re trying to switch tasks. /clear lets you quickly wipe the slate when you’re multitasking or working between projects. When to use: Switching to a new task or repository Copilot responses are referencing old files or earlier conversations You want to avoid context bleed between projects /exit, /quit: Exit the CLI. The commands /exit and /quit provide a direct way to end your session and disconnect from Copilot, ensuring resource cleanup and a clear boundary for session-based work. When to use: Wrapping up your session Logging out of a shared terminal /session, /usage: Display session usage metrics about the current CLI session. These commands give visibility into the actions Copilot has performed during your session, helping with audits, troubleshooting, and resource tracking. When to use: Auditing team/individual Copilot CLI usage Reviewing model or tool usage during a session Debugging runs or model use When you run either the /session or /usage commands, Copilot shows output similar to the following, displaying usage metrics about your session: Session ID: 221b5571-3998-47e1-b57a-552cf9078947 Started: 11/24/2025, 11:18:54 AM Last Modified: 11/24/2025, 11:18:54 AM Duration: 50s Working Directory: /Users/jacklynlee31 Usage: Total usage est: 0 Premium requests Total duration (API): 0s Total duration (wall): 50s Total code changes: 0 lines added, 0 lines removed Hit Enter or Esc to continue Directory and file access commands /add-dir: Allow Copilot to access a directory. By limiting Copilot’s access to the files you choose, you can ensure responses are relevant to your current scope and increase security. When to use: Scoping Copilot to a specific repository or subdirectory Navigating large codebases with sensitive files /add-dir <directory> For

tech blog

7 learnings from Anders Hejlsberg: The architect behind C# and TypeScript

Anders Hejlsberg’s work has shaped how millions of developers code. Whether or not you recognize his name, you likely have touched his work: He’s the creator of Turbo Pascal and Delphi, the lead architect of C#, and the designer of TypeScript.  We sat down with Hejlsberg to discuss his illustrious career and what it’s felt like to watch his innovations stand up to real world pressure. In a long-form conversation, Hejlsberg reflects on what language design looks like once the initial excitement fades, when performance limits appear, when open source becomes unavoidable, and how AI can impact a tool’s original function. What emerges is a set of patterns for building systems that survive contact with scale. Here’s what we learned. Watch the full interview above. Fast feedback matters more than almost anything else Hejlberg’s early instincts were shaped by extreme constraints. In the era of 64KB machines, there was no room for abstraction that did not pull its weight. “You could keep it all in your head,” he recalls. When you typed your code, you wanted to run it immediately. Anders Hejlsberg Turbo Pascal’s impact did not come from the Pascal language itself. It came from shortening the feedback loop. Edit, compile, run, fail, repeat, without touching disk or waiting for tooling to catch up. That tight loop respected developers’ time and attention. The same idea shows up decades later in TypeScript, although in a different form. The language itself is only part of the story. Much of TypeScript’s value comes from its tooling: incremental checking, fast partial results, and language services that respond quickly even on large codebases. The lesson here is not abstract. Developers can apply this directly to how they evaluate and choose tools. Fast feedback changes behavior. When errors surface quickly, developers experiment more, refactor more confidently, and catch problems closer to the moment they are introduced. When feedback is slow or delayed, teams compensate with conventions, workarounds, and process overhead.  Whether you’re choosing a language, framework, or internal tooling, responsiveness matters. Tools that shorten the distance between writing code and understanding its consequences tend to earn trust. Tools that introduce latency, even if they’re powerful, often get sidelined.  Scaling software means letting go of personal preferences  As Hejlsberg moved from largely working alone to leading teams, particularly during the Delphi years, the hardest adjustment wasn’t technical. It was learning to let go of personal preferences. You have to accept that things get done differently than you would have preferred. Fixing it would not really change the behavior anyway. Anders Hejlsberg That mindset applies well beyond language design. Any system that needs to scale across teams requires a shift from personal taste to shared outcomes. The goal stops being code that looks the way you would write it, and starts being code that many people can understand, maintain, and evolve together. C# did not emerge from a clean-slate ideal. It emerged from conflicting demands. Visual Basic developers wanted approachability, C++ developers wanted power, and Windows demanded pragmatism. The result was not theoretical purity. It was a language that enough people could use effectively. Languages do not succeed because they are perfectly designed. They succeed because they accommodate the way teams actually work. Why TypeScript extended JavaScript instead of replacing it TypeScript exists because JavaScript succeeded at a scale few languages ever reach. As browsers became the real cross-platform runtime, teams started building applications far larger than dynamic typing comfortably supports. Early attempts to cope were often extreme. Some teams compiled other languages into JavaScript just to get access to static analysis and refactoring tools. That approach never sat well with Hejlsberg. Telling developers to abandon the ecosystem they were already in was not realistic. Creating a brand-new language in 2012 would have required not just a compiler, but years of investment in editors, debuggers, refactoring tools, and community adoption. Instead, TypeScript took a different path. It extended JavaScript in place, inheriting its flaws while making large-scale development more tractable. This decision was not ideological, but practical. TypeScript succeeded because it worked with the constraints developers already had, rather than asking them to abandon existing tools, libraries, and mental models.  The broader lesson is about compromise. Improvements that respect existing workflows tend to spread while improvements that require a wholesale replacement rarely do. In practice, meaningful progress often comes from making the systems you already depend on more capable instead of trying to start over. Visibility is a part of what makes open source work TypeScript did not take off immediately. Early releases were nominally open source, but development still happened largely behind closed doors. That changed in 2014 when the project moved to GitHub and adopted a fully public development process. Features were proposed through pull requests, tradeoffs were discussed in the open, and issues were prioritized based on community feedback. This shift made decision-making visible. Developers could see not just what shipped, but why certain choices were made and others were not. For the team, it also changed how work was prioritized. Instead of guessing what mattered most, they could look directly at the issues developers cared about. The most effective open source projects do more than share code. They make decision-making visible so contributors and users can understand how priorities are set, and why tradeoffs are made. Leaving JavaScript as an implementation language was a necessary break For many years, TypeScript was self-hosted. The compiler was written in TypeScript and ran as JavaScript. This enabled powerful browser-based tooling and made experimentation easy. Over time, however, the limitations became clear. JavaScript is single-threaded, has no shared-memory concurrency, and its object model is flexible (but expensive). As TypeScript projects grew, the compiler was leaving a large amount of available compute unused. The team reached a point where further optimization would not be enough. They needed a different execution model. The controversial decision was to port the compiler to Go. This was not a rewrite. The goal was semantic fidelity. The new compiler needed to behave

tech blog

Modernize SMB Infrastructure with Dell NativeEdge

SMBs can modernize infrastructure, boost productivity, and prep for AI with Dell NativeEdge. Learn how to simplify your IT operations.   ​  ​SMBs can modernize infrastructure, boost productivity, and prep for AI with Dell NativeEdge. Learn how to simplify your IT operations. NativeEdge Blog | Dell

tech blog

Maia 200: The AI accelerator built for inference

Today, we’re proud to introduce Maia 200, a breakthrough inference accelerator engineered to dramatically improve the economics of AI token generation. Maia 200 is an AI inference powerhouse: an accelerator built on TSMC’s 3nm process with native FP8/FP4 tensor cores, a redesigned memory system with 216GB HBM3e at 7 TB/s and 272MB of on-chip SRAM, plus data movement engines that keep massive models fed, fast and highly utilized. This makes Maia 200 the most performant, first-party silicon from any hyperscaler, with three times the FP4 performance of the third generation Amazon Trainium, and FP8 performance above Google’s seventh generation TPU. Maia 200 is also the most efficient inference system Microsoft has ever deployed, with 30% better performance per dollar than the latest generation hardware in our fleet today. Maia 200 is part of our heterogenous AI infrastructure and will serve multiple models, including the latest GPT-5.2 models from OpenAI, bringing performance per dollar advantage to Microsoft Foundry and Microsoft 365 Copilot. The Microsoft Superintelligence team will use Maia 200 for synthetic data generation and reinforcement learning to improve next-generation in-house models. For synthetic data pipeline use cases, Maia 200’s unique design helps accelerate the rate at which high-quality, domain-specific data can be generated and filtered, feeding downstream training with fresher, more targeted signals. Maia 200 is deployed in our US Central datacenter region near Des Moines, Iowa, with the US West 3 datacenter region near Phoenix, Arizona, coming next and future regions to follow. Maia 200 integrates seamlessly with Azure, and we are previewing the Maia SDK with a complete set of tools to build and optimize models for Maia 200. It includes a full set of capabilities, including PyTorch integration, a Triton compiler and optimized kernel library, and access to Maia’s low-level programming language. This gives developers fine-grained control when needed while enabling easy model porting across heterogeneous hardware accelerators. YouTube Video Click here to load media Engineered for AI inference Fabricated on TSMC’s cutting-edge 3-nanometer process, each Maia 200 chip contains over 140 billion transistors and is tailored for large-scale AI workloads while also delivering efficient performance per dollar. On both fronts, Maia 200 is built to excel. It is designed for the latest models using low-precision compute, with each Maia 200 chip delivering over 10 petaFLOPS in 4-bit precision (FP4) and over 5 petaFLOPS of 8-bit (FP8) performance, all within a 750W SoC TDP envelope. In practical terms, Maia 200 can effortlessly run today’s largest models, with plenty of headroom for even bigger models in the future. Crucially, FLOPS aren’t the only ingredient for faster AI. Feeding data is equally important. Maia 200 attacks this bottleneck with a redesigned memory subsystem. The Maia 200 memory subsystem is centered on narrow-precision datatypes, a specialized DMA engine, on-die SRAM and a specialized NoC fabric for high‑bandwidth data movement, increasing token throughput. Optimized AI systems At the systems level, Maia 200 introduces a novel, two-tier scale-up network design built on standard Ethernet. A custom transport layer and tightly integrated NIC unlocks performance, strong reliability and significant cost advantages without relying on proprietary fabrics. Each accelerator exposes: 2.8 TB/s of bidirectional, dedicated scaleup bandwidth Predictable, high-performance collective operations across clusters of up to 6,144 accelerators This architecture delivers scalable performance for dense inference clusters while reducing power usage and overall TCO across Azure’s global fleet. Within each tray, four Maia accelerators are fully connected with direct, non‑switched links, keeping high‑bandwidth communication local for optimal inference efficiency. The same communication protocols are used for intra-rack and inter-rack networking using the Maia AI transport protocol, enabling seamless scaling across nodes, racks and clusters of accelerators with minimal network hops. This unified fabric simplifies programming, improves workload flexibility and reduces stranded capacity while maintaining consistent performance and cost efficiency at cloud scale. A cloud-native development approach A core principle of Microsoft’s silicon development programs is to validate as much of the end-to-end system as possible ahead of final silicon availability. A sophisticated pre-silicon environment guided the Maia 200 architecture from its earliest stages, modeling the computation and communication patterns of LLMs with high fidelity. This early co-development environment enabled us to optimize silicon, networking and system software as a unified whole, long before first silicon. We also designed Maia 200 for fast, seamless availability in the datacenter from the beginning, building out early validation of some of the most complex system elements, including the backend network and our second-generation, closed loop, liquid cooling Heat Exchanger Unit. Native integration with the Azure control plane delivers security, telemetry, diagnostics and management capabilities at both the chip and rack levels, maximizing reliability and uptime for production-critical AI workloads. As a result of these investments, AI models were running on Maia 200 silicon within days of first packaged part arrival. Time from first silicon to first datacenter rack deployment was reduced to less than half that of comparable AI infrastructure programs. And this end-to-end approach, from chip to software to datacenter, translates directly into higher utilization, faster time to production and sustained improvements in performance per dollar and per watt at cloud scale. Sign up for the Maia SDK preview The era of large-scale AI is just beginning, and infrastructure will define what’s possible. Our Maia AI accelerator program is designed to be multi-generational. As we deploy Maia 200 across our global infrastructure, we are already designing for future generations and expect each generation will continually set new benchmarks for what’s possible and deliver ever better performance and efficiency for the most important AI workloads. Today, we’re inviting developers, AI startups and academics to begin exploring early model and workload optimization with the new Maia 200 software development kit (SDK). The SDK includes a Triton Compiler, support for PyTorch, low-level programming in NPL and a Maia simulator and cost calculator to optimize for efficiencies earlier in the code lifecycle. Sign up for the preview here. Get more photos, video and resources on our Maia 200 site and read more details. Scott Guthrie is responsible for hyperscale cloud computing solutions and services including Azure, Microsoft’s

tech blog

Dell PowerScale: Scaling With Confidence Amid Supply Constraints

Why flash-only platforms from VAST Data and Pure Storage are being tested by industry-wide supply constraints – and how Dell PowerScale is built to deliver.   ​  ​Why flash-only platforms from VAST Data and Pure Storage are being tested by industry-wide supply constraints – and how Dell PowerScale is built to deliver. Artificial Intelligence Blog | Dell

tech blog

Meet the Dell Education PC Portfolio

Dell Education PCs are not only built to endure the demands of the school day but are also designed to empower students, teachers and administrators to excel in their educational journeys.   ​  ​Dell Education PCs are not only built to endure the demands of the school day but are also designed to empower students, teachers and administrators to excel in their educational journeys. Launch Blog | Dell

tech blog

Dell Pro Plus or Pro Max: Match Your Workflow

Pro Plus vs. Pro Max: nearly identical on paper—until you look under the hood. CPU architecture reveals which is built for your workload.   ​  ​Pro Plus vs. Pro Max: nearly identical on paper—until you look under the hood. CPU architecture reveals which is built for your workload. Dell Pro Max Blog | Dell

tech blog

How Studios Scale Creativity with Modern Media Pipelines

As data volumes surge and teams collaborate across continents, media and entertainment studios are investing in infrastructure built for speed, resilience and secure access to keep production on schedule.   ​  ​As data volumes surge and teams collaborate across continents, media and entertainment studios are investing in infrastructure built for speed, resilience and secure access to keep production on schedule. Customer Blog | Dell

tech blog

Disney Animator Makes Feature Animations for $20M

Disney veteran Tom Bancroft proves feature animation can skip $100M budgets with a decentralized studio model.   ​  ​Disney veteran Tom Bancroft proves feature animation can skip $100M budgets with a decentralized studio model. Dell Pro Max Blog | Dell

tech blog

The Challenge of Protecting Brain Health Data

Privacy-first AI, faster research: Dell Pro Max workstations and NVIDIA RTX GPUs keep brain health data secure and accelerate discovery.   ​  ​Privacy-first AI, faster research: Dell Pro Max workstations and NVIDIA RTX GPUs keep brain health data secure and accelerate discovery. Healthcare Blog | Dell

tech blog

Resilience Debt: The Silent Risk Undermining Cyber Recovery

Resilience debt is growing silently—until it breaks recovery. Why confidence, not attacks, may be your biggest cyber risk.   ​  ​Resilience debt is growing silently—until it breaks recovery. Why confidence, not attacks, may be your biggest cyber risk. Cyber Resilience Blog | Dell

Scroll to Top